
Years
Consulting and Corporate
Work Experience


Makoti L.
Data Management & Analytics
Hilary Manson
The COP26 summit brought parties together to accelerate action towards the goals of the Paris Agreement and the UN Framework Convention on Climate Change.
The HDI was created to emphasize that people and their capabilities should be the ultimate criteria for assessing the development of a country, not economic growth alone. The HDI can also be used to question national policy choices, asking how two countries with the same level of GNI per capita can end up with different human development outcomes.
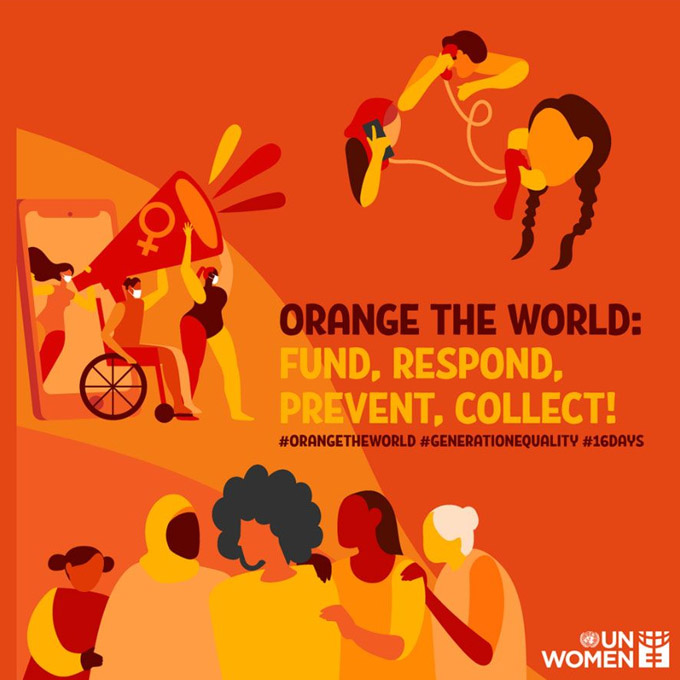
The 16 Days of Activism against Gender-Based Violence is an annual international campaign that kicks off on 25 November, the International Day for the Elimination of Violence against Women, and runs until 10 December, Human Rights Day.
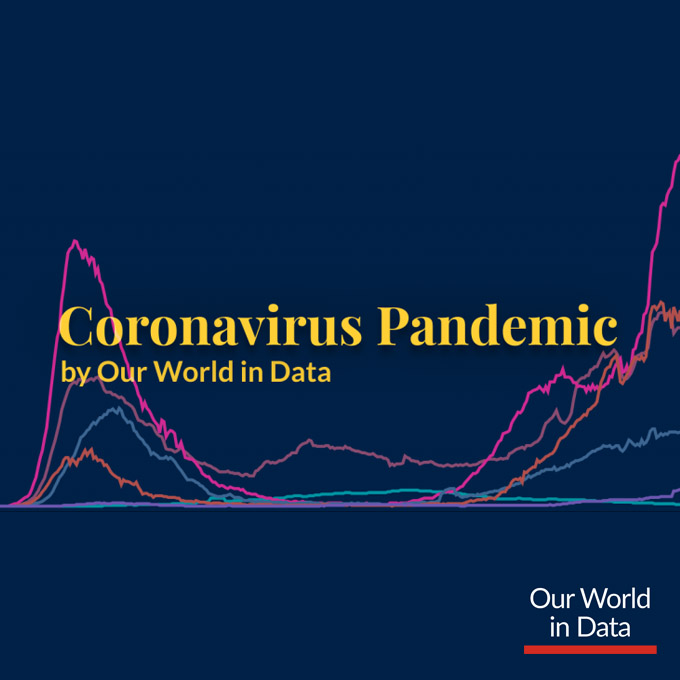
In a fast-evolving pandemic it is not a simple matter to identify the countries that are most successful in making progress against it. For a comprehensive assessment, OWID tracks the impact of the pandemic across their publication and has built country profiles for 207 countries to study in depth the statistics on the coronavirus pandemic for every country in the world.